Delogue PLM · 2025
Delogue PLM · 2025
Designing progression: Rebuilding a tool teams had stopped trusting.
From Complexity to Clarity:
Reshaping Information Architecture for Better UX
A sampling coordination board organised by colour categories was causing teams to work around the tool rather than with it. I led a service design-led redesign - mapping the multi-role workflow end-to-end before restructuring the board around real progression stages and handover moments.
A sampling coordination board organised by colour categories was causing teams to work around the tool rather than with it. I led a service design-led redesign - mapping the multi-role workflow end-to-end before restructuring the board around real progression stages and handover moments.
A sampling coordination board organised by colour categories was causing teams to work around the tool rather than with it. I led a service design-led redesign - mapping the multi-role workflow end-to-end before restructuring the board around real progression stages and handover moments.
Eliminated parallel tracking in spreadsheets, reduced cross-role coordination overhead, and restored the board as a trusted single source of truth.
Eliminated parallel tracking in spreadsheets, reduced cross-role coordination overhead, and restored the board as a trusted single source of truth.
Eliminated parallel tracking in spreadsheets, reduced cross-role coordination overhead, and restored the board as a trusted single source of truth.
My Role
Lead Product Designer
Scope
Service Design-led
Impact
Product, Engineering, CS
Service Design
Information Architecture
User Research
UX Design
Workflow mapping
Multi-role coordination
problem
When a tool don't reflect real work,
people work around it
Understanding
the status-quo
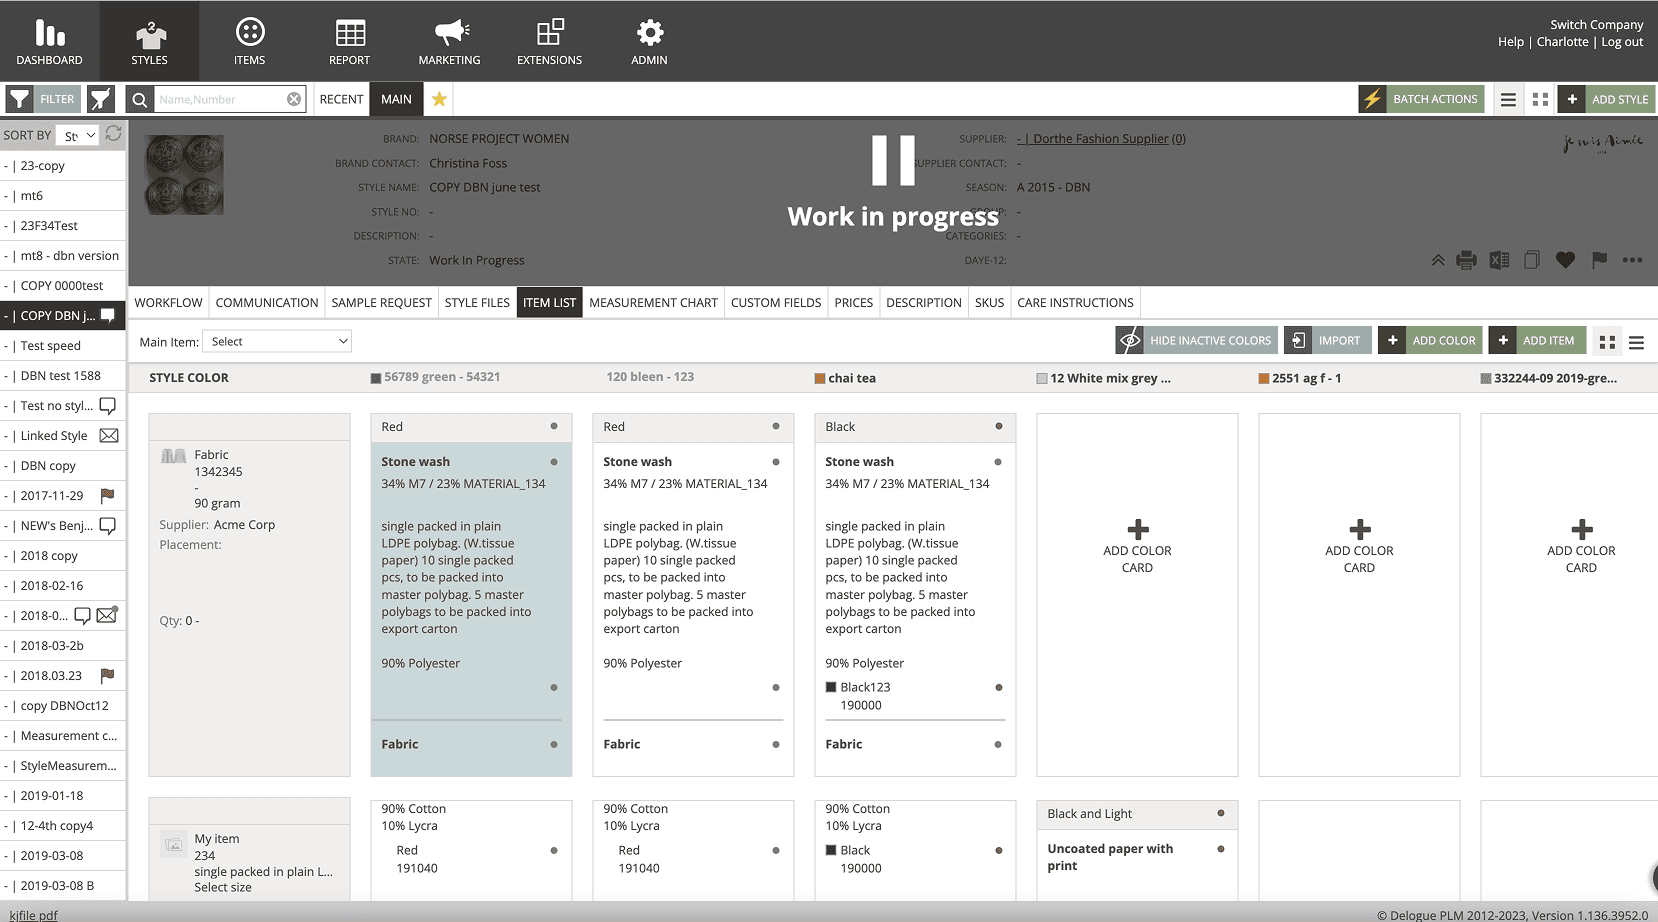
The sampling board grouped work by colour-coded categories: Fabric type, supplier, material. Logical on paper. But teams didn't coordinate by category. They coordinated by progression: where is this sample in the process, who has it, and what needs to happen next?
The mismatch forced constant translation. Teams maintained parallel spreadsheets to track actual status. Status check meetings multiplied. The board became something to manage around rather than something that supported the work - and trust in it as a source of truth eroded quietly over time.
Crucially, this wasn't a single-user problem. Sampling coordination spans multiple roles - designers, sourcing teams, suppliers - each with different needs at different moments in the workflow. A fix that worked for one role but ignored the others would just shift the problem.
Uncovering navigation insights through workflow mapping and JTBD analysis.
Goal: Aligning the findings with our product vision and design principles
- Aligned product direction by collaborating with Customer Success and Sales
- Improved feature adoption through on-site visits and data-driven workflow insights
- Enhanced information architecture by identifying user logic via card sorting exercises.
before: The system was logically organised, but behaviourally misaligned.
Uncovering navigation insights through workflow mapping and JTBD analysis.
Goal: Aligning the findings with our product vision and design principles
- Aligned product direction by collaborating with Customer Success and Sales
- Improved feature adoption through on-site visits and data-driven workflow insights
- Enhanced information architecture by identifying user logic via card sorting exercises.
overwhelming
Faster
Onboarding
Unnecessary information distracted from the task at hand, causing decision fatigue.
misaligned
Boosted
Efficiency
The board's structure didn't match how teams actually tracked progress, forcing workarounds.
unreliable
Scalable
Design
Teams stopped trusting the board as source of truth, defaulting to memory and side-notes.
discovery
Zooming out before zooming in
Understanding
the status-quo
I visited customers on-site and interviewed teams during live coordination work - not staged walkthroughs, but actual sampling cycles under real deadline pressure. This was important: the workarounds only become visible when you observe work as it happens, not as people describe it afterwards.
Three things stood out immediately. Work rarely followed clean linear states - samples moved back and forth between stages constantly. Progress was understood through sequence, not labels. And the cognitive work of tracking status wasn't happening in the tool at all - it was distributed across memory, side-notes, and informal messages.
Uncovering navigation insights through workflow mapping and JTBD analysis.
Goal: Aligning the findings with our product vision and design principles
- Aligned product direction by collaborating with Customer Success and Sales
- Improved feature adoption through on-site visits and data-driven workflow insights
- Enhanced information architecture by identifying user logic via card sorting exercises.
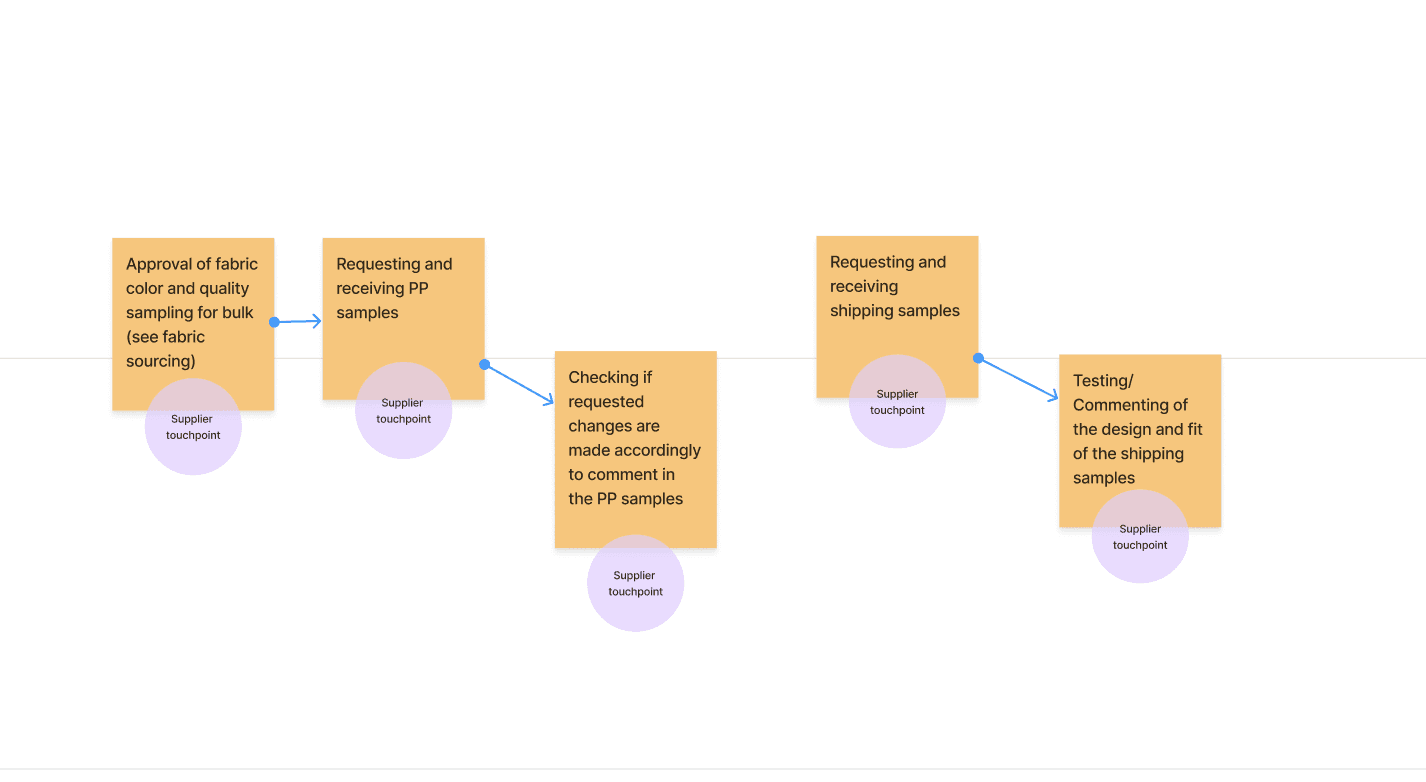
Service map: The sampling workflow
Uncovering navigation insights through workflow mapping and JTBD analysis.
Goal: Aligning the findings with our product vision and design principles
- Aligned product direction by collaborating with Customer Success and Sales
- Improved feature adoption through on-site visits and data-driven workflow insights
- Enhanced information architecture by identifying user logic via card sorting exercises.
Mapping the workflow end-to-end within the broader product creation ecosystem made the real problem legible: this wasn't a board layout issue, it was a coordination infrastructure issue. The tool needed to carry shared context across roles, not just display status for one.
Uncovering navigation insights through workflow mapping and JTBD analysis.
Goal: Aligning the findings with our product vision and design principles
- Aligned product direction by collaborating with Customer Success and Sales
- Improved feature adoption through on-site visits and data-driven workflow insights
- Enhanced information architecture by identifying user logic via card sorting exercises.

key decisions
Three decisions that shaped the redesign
Understanding
the status-quo
decision
Replace categories with progression stages
Understanding
the status-quo
The board grouped work by colour-coded categories - fabric type, supplier - but teams tracked work by where it was in the process, not what category it belonged to. I restructured columns to represent real workflow stages in the sampling process, from request through to approval.
The trade-off: Losing the category view meant some users couldn't group by material type at a glance. Research showed progression visibility was the primary coordination need - category filters were added as a supplementary layer without driving the layout.
Uncovering navigation insights through workflow mapping and JTBD analysis.
Goal: Aligning the findings with our product vision and design principles
- Aligned product direction by collaborating with Customer Success and Sales
- Improved feature adoption through on-site visits and data-driven workflow insights
- Enhanced information architecture by identifying user logic via card sorting exercises.

decision
Make cards movable, not static
Understanding
the status-quo
Work in sampling doesn't follow a clean linear path. Samples get sent back, re-evaluated, or put on hold - but the existing board had no way to reflect this. Cards became draggable between stages, allowing teams to mirror actual progress including backward movement. The goal was not to enforce a process, but to reflect one.
The trade-off: Movable cards introduced the risk of misplacement and required clear stage definitions to prevent confusion. We mitigated this with confirmation states and audit trails so any movement was traceable and reversible.
Uncovering navigation insights through workflow mapping and JTBD analysis.
Goal: Aligning the findings with our product vision and design principles
- Aligned product direction by collaborating with Customer Success and Sales
- Improved feature adoption through on-site visits and data-driven workflow insights
- Enhanced information architecture by identifying user logic via card sorting exercises.

decision
Design for handover visibility,
not individual tracking
Understanding
the status-quo
This was the decision that most directly addressed the service design problem. Sampling coordination spans multiple roles - designers, sourcing, suppliers - each needing to know what happened before them and what's expected of them next. The original board only showed current state. It had no language for transition.
I surfaced handover moments as first-class elements. Cards show who moved them, when, and what action is needed next - making the board a coordination tool rather than a personal status tracker. This is the difference between designing a screen and designing a shared service.
The trade-off: Adding transition metadata increased card complexity. We used progressive disclosure to keep it manageable - summary visible, full detail on expand - so the board stayed scannable while supporting deeper coordination needs when required.
Uncovering navigation insights through workflow mapping and JTBD analysis.
Goal: Aligning the findings with our product vision and design principles
- Aligned product direction by collaborating with Customer Success and Sales
- Improved feature adoption through on-site visits and data-driven workflow insights
- Enhanced information architecture by identifying user logic via card sorting exercises.
retrospective
from workaround to source of truth
Understanding
the status-quo
The most meaningful signal wasn't a metric - it was behavioural.
Teams stopped maintaining side-tracking systems. When a tool earns that kind of trust,
the design has done its job.
Understanding
the status-quo
overhead
Faster
Onboarding
Parallel spreadsheet tracking eliminated - board became the single coordination point
smooth handover
Boosted
Efficiency
Cross-role handovers became visible - teams reported significantly fewer "who's responsible?" moments
greater trust
Scalable
Design
Board shifted from something teams managed around to something that actively supported their work
key insight
"
The board's layout was the symptom. The real problem was that no shared representation of the workflow existed anywhere - not in the tool, not in any artefact.
Before redesigning the interface, I had to make the service legible: map the roles, surface the handovers, name where coordination broke down. Only then did the right design become obvious. The goal was never to simplify the work - it was to mirror it faithfully enough that the tool could carry it.
Uncovering navigation insights through workflow mapping and JTBD analysis.
Goal: Aligning the findings with our product vision and design principles
- Aligned product direction by collaborating with Customer Success and Sales
- Improved feature adoption through on-site visits and data-driven workflow insights
- Enhanced information architecture by identifying user logic via card sorting exercises.
Charlotte Kleckers
Copenhagen